01
Data Analysis
Finding structure and meaning in raw information.
- Data Cleaning
- Data Transformation
- Exploratory Data Analysis
- Statistical Analysis
- Data Interpretation
I'm a recent B.Tech graduate passionate about Data Analytics, business intelligence, and data visualization. I enjoy transforming complex datasets into meaningful insights that support smarter business decisions.

I'm Nagaraju, a recent B.Tech graduate with a genuine curiosity for turning raw data into clear, useful answers.
My interest in Data Analytics grew from enjoying the moment when scattered numbers start to form a pattern. Since then, I've been learning and applying analytical techniques — cleaning data, exploring it carefully, and building dashboards that make information easier to understand and act on.
I've built independent analytics projects using Power BI, SQL, Python, Tableau and Excel. I'm especially drawn to business intelligence: the ideas that help teams see what's happening, understand why, and make more confident decisions. I'm at the beginning of my career, and I'm genuinely excited about learning from every problem I get to work on.
A growing set of tools and techniques, used to explore, interpret and communicate data clearly.
Finding structure and meaning in raw information.
Writing code to make analysis repeatable and reliable.
Asking the right questions of structured data.
Turning findings into visuals people actually use.
Building interactive, well-structured reporting experiences.
Analytics moves quickly — so do I. Every new tool is another way to tell a better data story.
View certificationsA selection of independent dashboards and analytics explorations built to practise turning data into decisions.
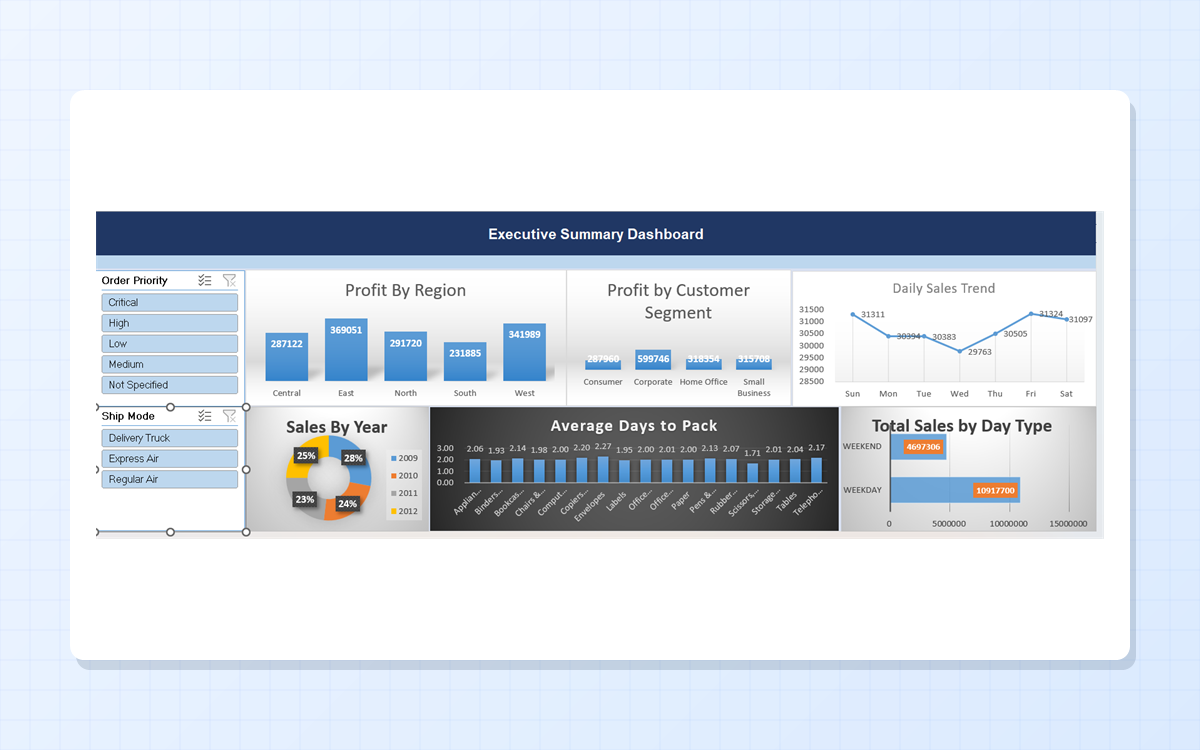 Microsoft Excel
Interactive sales and executive summary dashboard built in Microsoft Excel to analyze sales performance, profitability, customer segments, order quantities and shipping operations. Raw data was cleaned and transformed with lookup functions and formulas, then explored through Pivot Tables, Pivot Charts and interactive slicers.
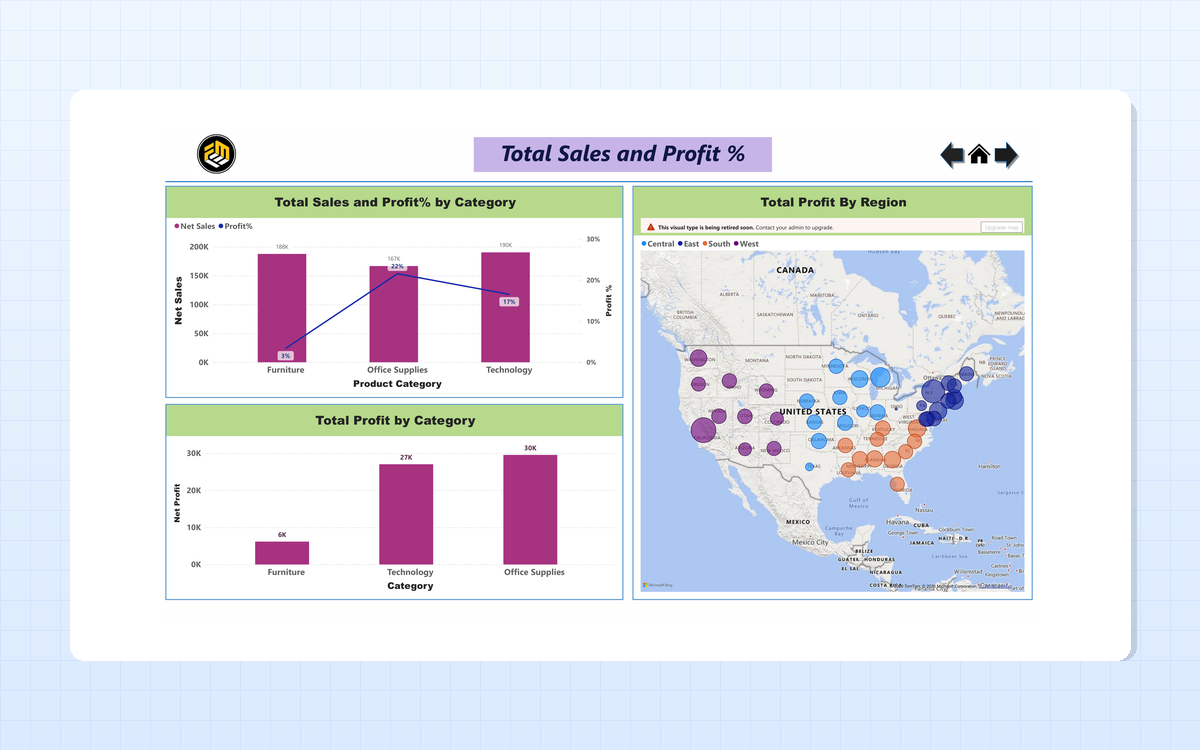 Power BI
Multi-page interactive Power BI dashboard analyzing sales performance, profitability, product and customer contributions, regional trends and target achievement. Built with Power Query, DAX and data modeling, with KPI measures, moving averages, year-over-year comparisons and interactive filters.
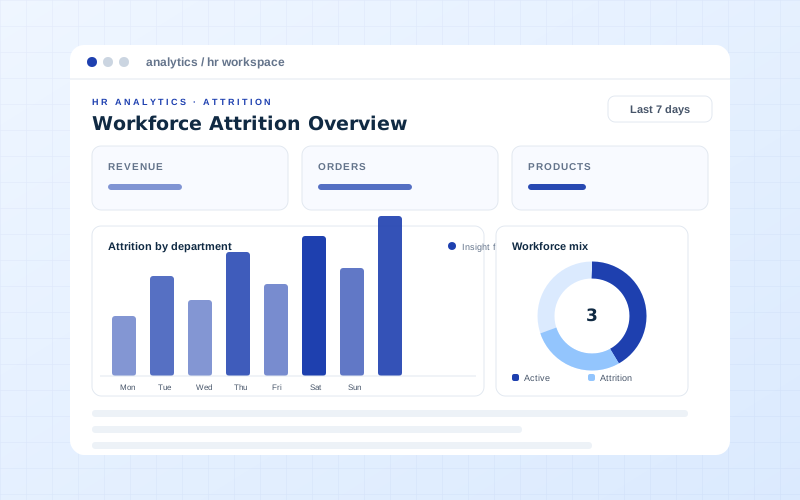 Tableau
Human resource analytics dashboard exploring employee attrition, workforce metrics, employee demographics, and job-related insights.
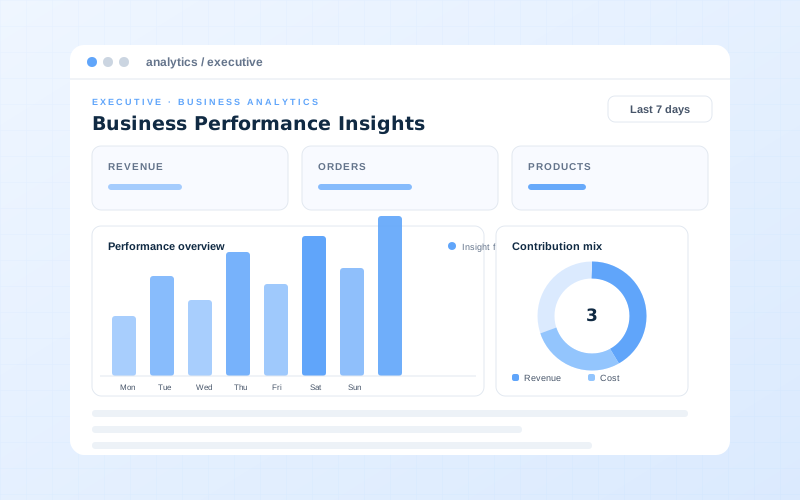 Power BI
Executive-focused analytics dashboard providing business performance insights through KPIs, charts, and interactive visualizations.
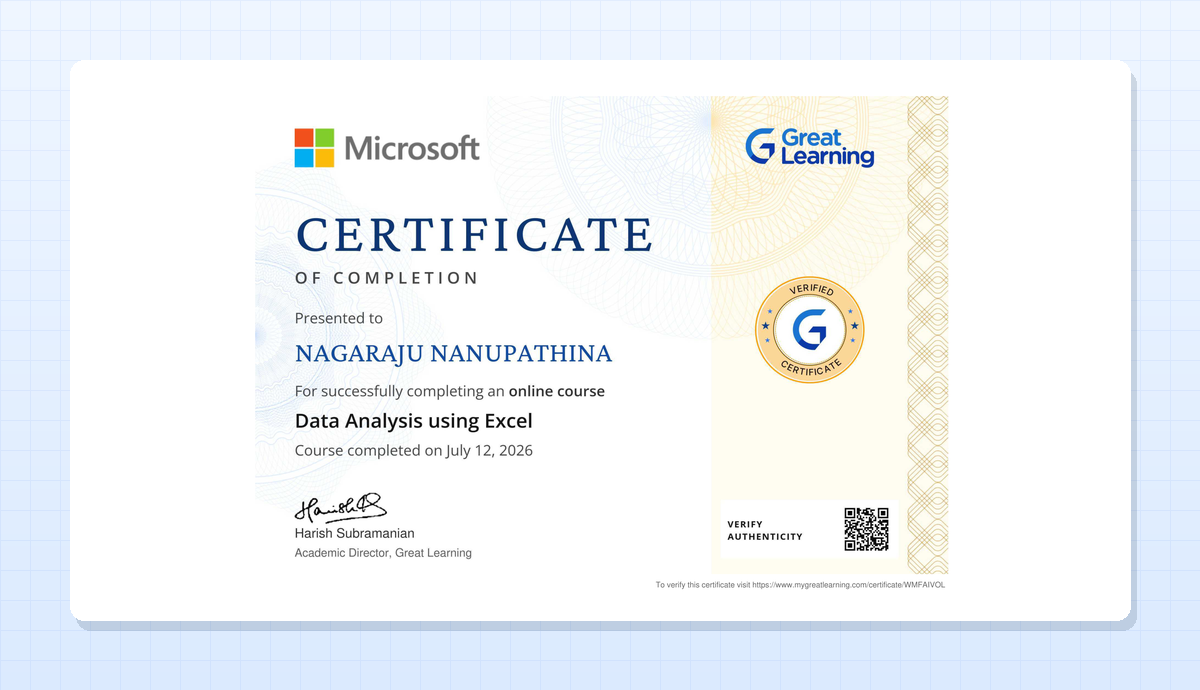
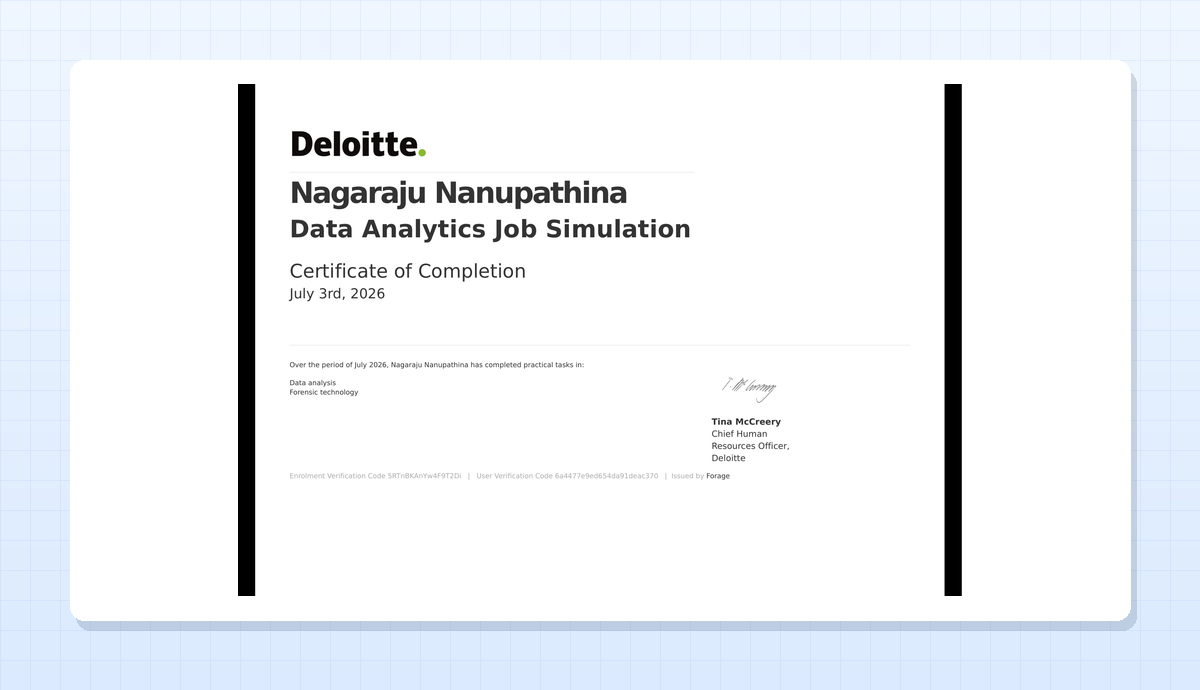
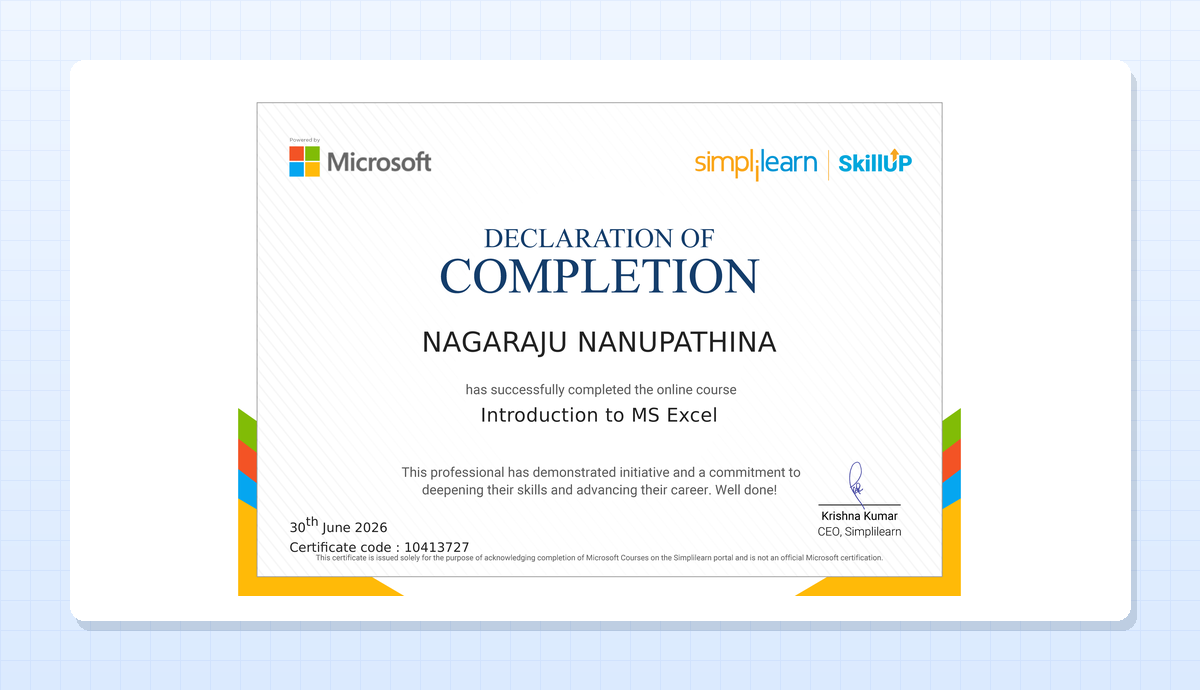
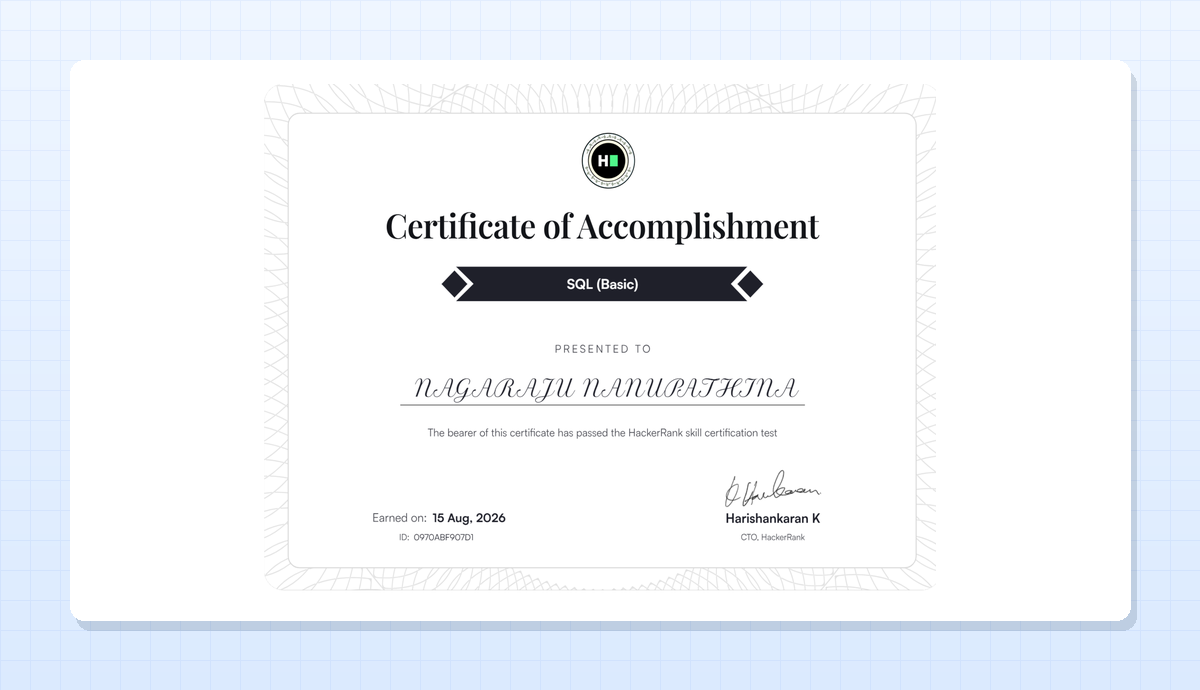
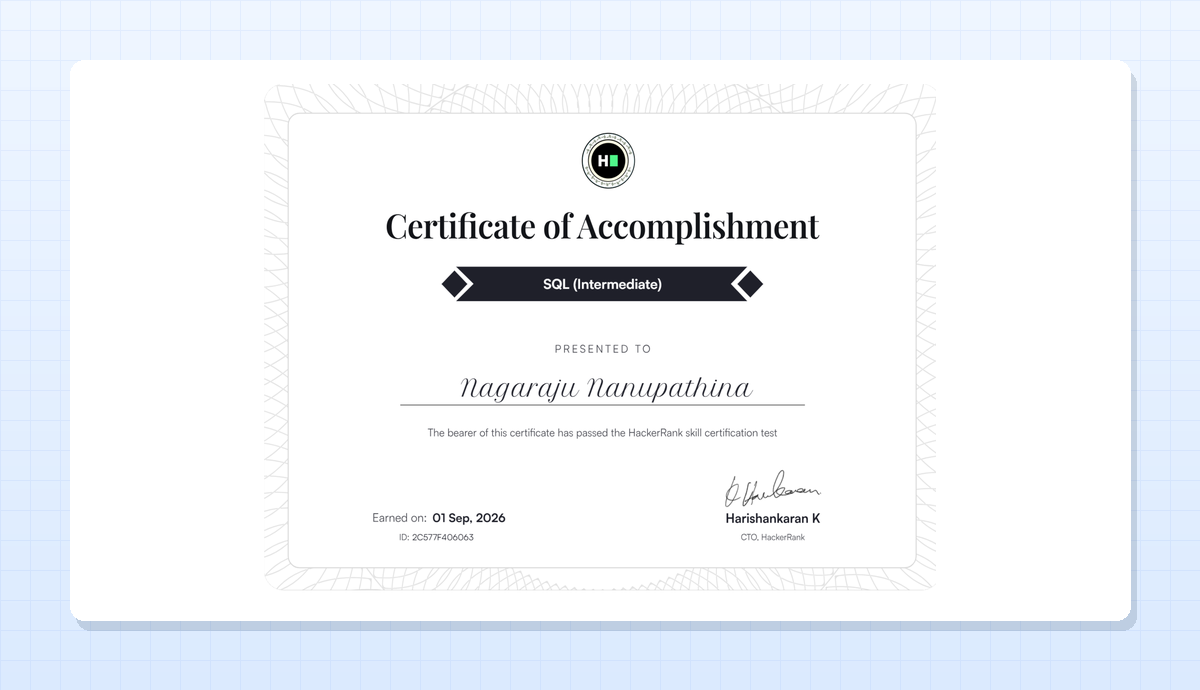
A growing collection of learning milestones — certifications earned through practice and applied learning.
Computer Science and Engineering
Sai Spurthi Institute of Technology
B.Gangaram, Telangana
Sri Chaitanya Junior Kalasala
Hyderabad, Telangana
Z.P.S.S
Aswaraopeta, Telangana
I'm actively seeking entry-level opportunities in Data Analytics where I can apply my technical knowledge, analytical thinking, and problem-solving abilities while continuing to grow professionally.
Whether it's an opportunity, a question, or a conversation about data — my inbox is open.
Fill in the details and I'll get back to you.